MQL4 Reference ![]() MQL5 features
MQL5 features ![]() Charts
Charts
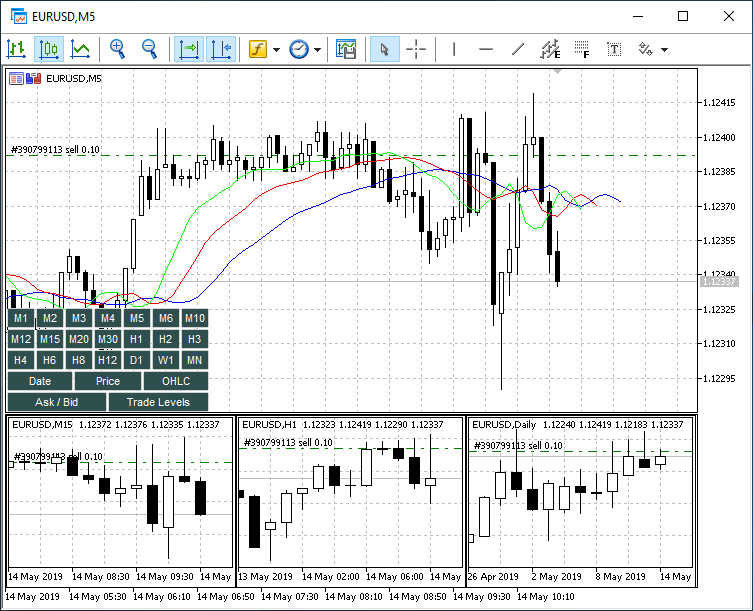
MQL5 chartsThe new generation platform has two times more timeframes (21 vs 9), as well as the precise time scale. Now graphical objects are not necessarily linked to bars. Object anchors can be placed in any position between the chart bars. Moreover, when switching between timeframes, the accurate positioning of the control points of the object is preserved. New built-in indicators and analytical tools have also been added. The new OBJ_CHART graphical object is most notable in terms of the complex technical analysis. It allows creating an unlimited number of nested charts, set all the necessary properties (color scheme, timeframe, symbol) and even impose indicators on them. Thus, a usual price chart can be turned into a complex analytical tool by quickly switching between symbols and timeframes in a single mouse click.
If you use several monitors for trading, then you will certainly appreciate another advantage of the new platform — floating chart windows. Any symbol chart can now be detached from the terminal window and moved to the necessary monitor. An example of such a chart is shown in the image. Add indicators and an EA with the graphical panel to a floating chart to get a real trading control center. Floating windows can also be moved and resized from MQL5 programs using the chart properties (CHART_IS_DOCKED and others). The third distinctive feature of the fifth generation platform is the ability to create custom symbols or synthetic indices. To do that, simply enter the calculation formula or download files with minute bars or tick history. You can also work with custom symbols using MQL5 language. The appropriate functions allow you to automate collecting and preparing history data, open charts and update them in real time, as well as test your EAs in the strategy tester using custom symbols. Explore MQL5 language features and take your programming skills to the next level. |